
กรอบงานผลกระทบของ Varmers
ผลิตอย่างประหยัดมากขึ้น วัดอย่างระมัดระวังมากขึ้น
Varmers เชื่อมโยงการวางแผนการปลูกพืชตามความต้องการกับการผลิตในสภาพแวดล้อมที่ควบคุมได้ ข้ออ้างด้านความยั่งยืนที่แข็งแกร่งที่สุดไม่ใช่เพียงตราสัญลักษณ์ประดับตกแต่ง แต่เป็นการตัดสินใจด้านการผลิตที่เริ่มต้นจากความต้องการที่ทราบแน่ชัด และใช้ปัจจัยการผลิตที่วัดได้
สามชั้นที่เชื่อมต่อกัน
ความต้องการ การผลิต และการจัดหาในท้องถิ่น
ชั้นต่าง ๆ เหล่านี้อธิบายว่า Varmers สามารถสร้างผลกระทบได้ในด้านใด และควรวัดผลด้านใดในรายงานประจำ
การผลิตตามความต้องการ
การตกลงกันเกี่ยวกับความต้องการก่อนการปลูกสามารถช่วยลดการผลิตเกินตัวเพื่อเก็งกำไร การลดราคาอย่างบังคับ และผลผลิตที่ขายไม่หมดได้
- ปริมาณที่ขายจริงเทียบกับปริมาณที่จัดวาง
- สินค้าส่วนเกินที่ขายได้เทียบกับสินค้าส่วนเกินที่ถูกทิ้ง
- การเปลี่ยนแปลงการคาดการณ์และการปรับปริมาณผลผลิต
ข้อมูลเข้าที่ได้รับการควบคุม
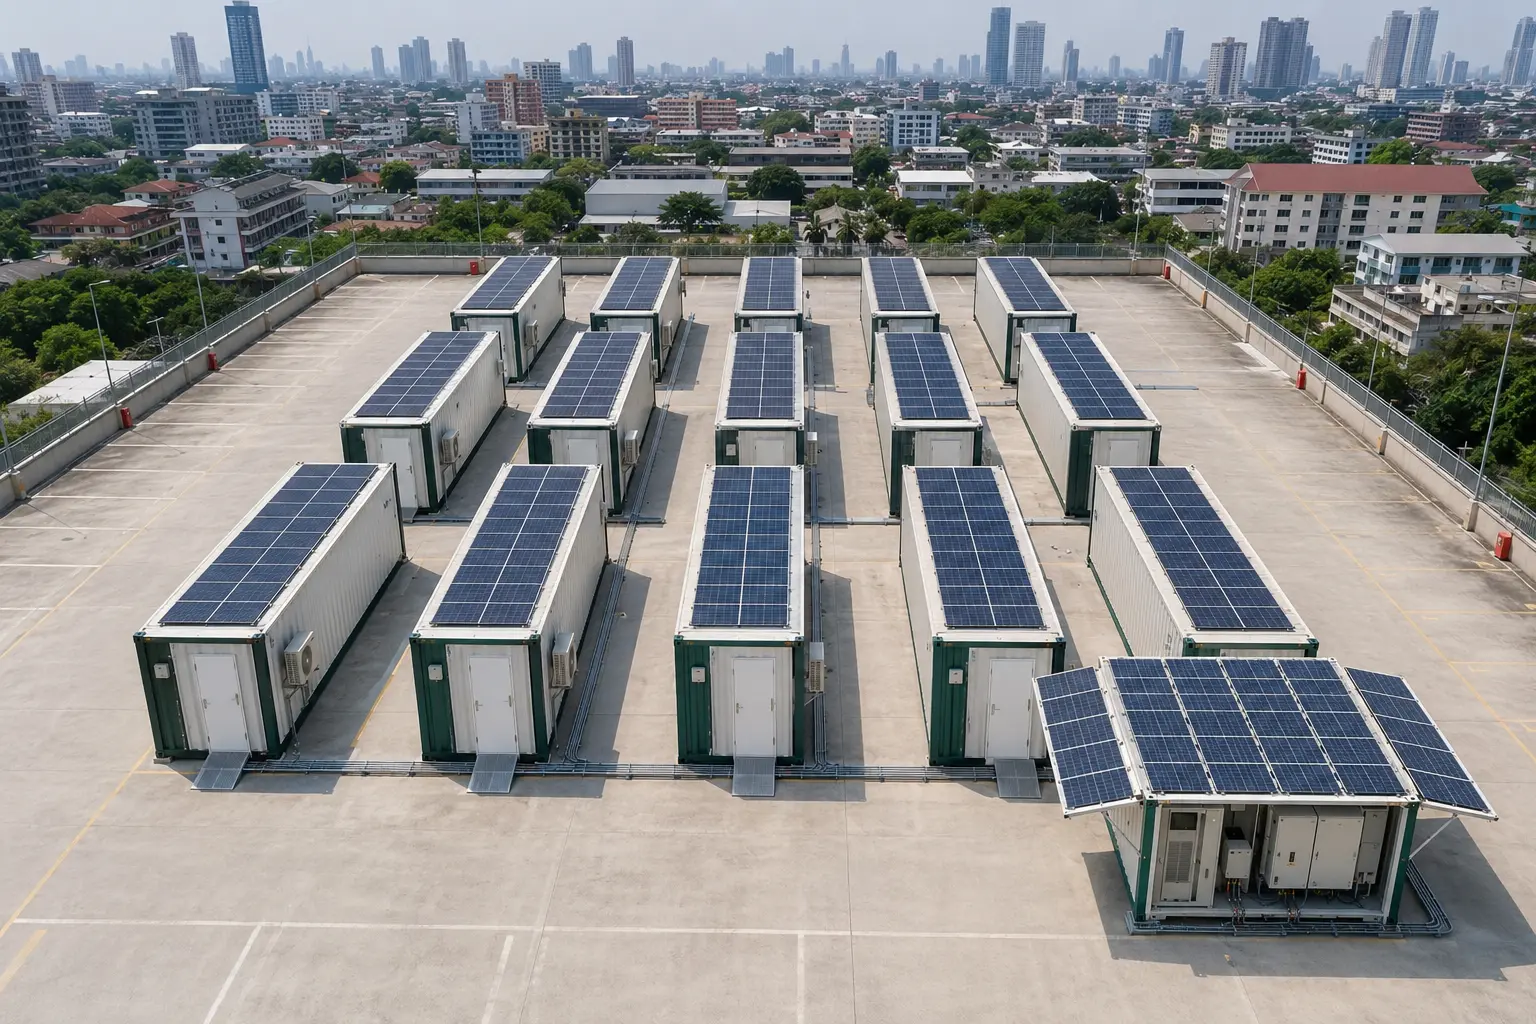
การปลูกพืชในร่มสามารถนำน้ำกลับมาใช้ใหม่ และปรับปริมาณแสงและสารอาหารให้เหมาะสมกับสูตรการปลูกพืชได้ ส่วนระบบพลังงานแสงอาทิตย์สามารถลดการใช้ไฟฟ้าจากเครือข่ายไฟฟ้าได้ หากสถานที่และระบบได้รับการออกแบบให้เหมาะสมกับขนาด
- ปริมาณน้ำที่ใช้ต่อกิโลกรัม
- การผลิตไฟฟ้าและพลังงานแสงอาทิตย์
- การใช้สารอาหารและสารตั้งต้น
การจัดส่งในท้องถิ่น
การปลูกพืชใกล้กับลูกค้าในกรุงเทพฯ สามารถลดระยะทางระหว่างการเก็บเกี่ยว การบรรจุ และการส่งมอบได้
- ระยะเวลาจากตอนเก็บเกี่ยวจนถึงการส่งมอบ
- ระยะทางการขนส่งและประสิทธิภาพการบรรทุก
- สินค้าเสียหายหรือถูกปฏิเสธหลังการส่งมอบ
สิ่งที่รายงานที่ดีต้องมี
ให้ทุกตัวเลขสามารถติดตามได้
ตัวเลขด้านความยั่งยืนจะมีความน่าเชื่อถือได้ก็ต่อเมื่อผู้อ่านสามารถเข้าใจได้ว่าตัวเลขนั้นเปรียบเทียบกับอะไร ข้อมูลมาจากที่ไหน และสิ่งที่ถูกยกเว้นมีอะไรบ้าง
การสอดคล้องกับเป้าหมายการพัฒนาที่ยั่งยืน (SDG) ของสหประชาชาติ
เป้าหมายที่เกี่ยวข้อง ซึ่งเชื่อมโยงกับกิจกรรมจริง
สัญลักษณ์ SDG ควรชี้ไปยังโครงการและผลลัพธ์ที่สามารถวัดได้ แทนที่จะสื่อถึงการรับรองอย่างเป็นทางการจากสหประชาชาติ
ความหิวเป็นศูนย์
ความสามารถในการผลิตในท้องถิ่นที่สามารถขยายได้ และการผลิตที่เชื่อถือได้ตลอดทั้งปี ซึ่งอยู่ใกล้กับพื้นที่ที่มีความต้องการ
สุขภาพที่ดีและความสุข
ผลิตภัณฑ์เกษตรที่ปลูกตามขั้นตอนที่ควบคุมอย่างเคร่งครัด โดยไม่ใช้สารกำจัดศัตรูพืชสังเคราะห์
น้ำสะอาดและระบบสุขาภิบาล
ระบบชลประทานแบบหมุนเวียน โดยวัดปริมาณน้ำที่ใช้เทียบกับผลผลิตที่ขายได้
พลังงานราคาถูกและสะอาด
ระบบพลังงานแสงอาทิตย์ที่ติดตั้ง ณ สถานที่ (ตามความต้องการ) และการติดตามตรวจสอบการใช้ไฟฟ้าของฟาร์มอย่างโปร่งใส
งานที่มีคุณภาพและการเติบโตทางเศรษฐกิจ
งานฝีมือท้องถิ่นด้านการประกอบเครื่องจักรในฟาร์ม การผลิตพืช การเกษตรศาสตร์ และการดำเนินงาน
อุตสาหกรรม นวัตกรรม และโครงสร้างพื้นฐาน
การออกแบบฟาร์มแบบโมดูลาร์ ระบบการผลิตที่ควบคุมได้ และความรู้ด้านการดำเนินงาน
เมืองและชุมชนที่ยั่งยืน
การผลิตอาหารในขนาดเล็กที่ตั้งอยู่ภายในหรือใกล้กับชุมชนที่ให้บริการ
การบริโภคและการผลิตอย่างรับผิดชอบ
การปลูกพืชตามความต้องการ การใช้ผลผลิต การวัดปริมาณปัจจัยการผลิต และการรายงานปริมาณของเสีย
การดำเนินการเพื่อรับมือกับปัญหาสภาพอากาศ
การบูรณาการระบบพลังงานแสงอาทิตย์ การวัดปริมาณพลังงาน และสมมติฐานที่โปร่งใสเกี่ยวกับปริมาณคาร์บอนตลอดวงจรชีวิต
ชีวิตบนบก
ผลผลิตสูงต่อพื้นที่ และสามารถปลูกได้โดยไม่ต้องใช้สารกำจัดศัตรูพืชสังเคราะห์ ซึ่งช่วยลดความกดดันต่อพื้นที่ดิน
ความร่วมมือเพื่อบรรลุเป้าหมาย
โครงการที่เชื่อมโยงผู้ปลูกอาหาร เชฟ โรงแรม ผู้ค้าปลีก และพันธมิตรด้านเทคโนโลยี
ขั้นตอนการรายงานต่อไป
เปลี่ยนกรอบงานนี้ให้เป็นหน้าแสดงผลผลกระทบประจำปี
โค้ดนี้สร้างโครงสร้างสาธารณะขึ้น ผู้ใช้สามารถเปลี่ยนข้อความในเฟรมเวิร์กเป็นตารางข้อมูลที่วัดได้และรายงานที่สามารถดาวน์โหลดได้ในภายหลัง
Varmers ควรวัดอะไรก่อน?
เริ่มด้วยข้อมูลการดำเนินงานที่เชื่อถือได้และอยู่ใกล้กับขั้นตอนการผลิตแล้ว ได้แก่ ปริมาณที่ปลูก ปริมาณที่สัญญาไว้ ปริมาณที่เก็บเกี่ยว ปริมาณที่ถูกปฏิเสธหรือทิ้งไป รวมถึงปริมาณน้ำ ไฟฟ้า และระยะทางการขนส่ง
Varmers มีส่วนช่วยบรรลุเป้าหมายการพัฒนาที่ยั่งยืน (SDGs) 11 ข้อหรือไม่?
Varmers ได้จัดหมวดหมู่กิจกรรมของตนให้สอดคล้องกับ 11 เป้าหมายที่เกี่ยวข้อง นี่เป็นกรอบการทำงานเพื่อสร้างการมีส่วนร่วม ไม่ใช่การรับรองจากสหประชาชาติ ทุกคำกล่าวอ้างต่อสาธารณะควรเชื่อมโยงกับกิจกรรมที่สามารถวัดผลได้และขอบเขตที่กำหนดไว้อย่างชัดเจน
โครงการก่อสร้างฟาร์มสามารถใช้กรอบงานเดียวกันได้หรือไม่?
ใช่ แต่การก่อสร้างและอุปกรณ์ก่อให้เกิดข้อจำกัดเพิ่มเติม ซึ่งรวมถึงวัสดุที่ใช้ในระบบ การทดสอบและรับมอบระบบ ส่วนผสมของแหล่งพลังงานไฟฟ้าในท้องถิ่น และวิธีการดำเนินงานของลูกค้า
รายงานควรได้รับการตรวจสอบอย่างอิสระหรือไม่?
การตรวจสอบอย่างอิสระมีค่ามากขึ้นเรื่อยๆ เมื่อคำกล่าวอ้างดังกล่าวมีอิทธิพลต่อการจัดซื้อจัดจ้าง การลงทุน หรือการรายงานต่อสาธารณะ หน้าดังกล่าวควรระบุระดับการตรวจสอบอย่างชัดเจน